Saturday, June 27, 2020

Webinar on How DAX Works | Evaluation Context | Filter Context & Row Context | DAX for Power Pivot and Power BI in Hindi

How DAX Works?

Why It's important to know how it is working on functions. because if you know how any language works then you can easily learn and write complex functions. DAX looks like Excel formula language but it has some unique and powerful context. It the Evaluation context, unlike Excel you have to define every test and input in the formula. But not in DAX.

There are two contexts that effect DAX calculation.

Evaluation Context  ( Fliter context & Row context)

Evaluation Context is a combination of the Filter & Raw context. it's mean there is a current context

which has some filters or slicers lavy on the current data model. In this webinar, we have discussed these concepts in detail.


Sunday, June 21, 2020

DAX Versus Excel Formula Language Introduction to beginners

DAX Versus Excel Formula Language Introduction to beginners

You are familiar with Excel formulas. Now a day DAX becomes popular among IT professionals. because of its scope and power to solve with big data. unlike Excel, its formulas work on a column, not a single cell.

DAX is the programming language of Microsoft SQL Server Analysis Services (SSAS) and Microsoft Power Pivot for Excel later it comes with the bundle of Power BI.

Understanding the data model

DAX is a language specially created to calculate business formulas over a data model. You might already know what a data model is, but if you are not familiar with it, it is worth dedicating some webinars to a description of data models and relationships, so as to create a framework on which you will build your DAX learning.

data model with relationship


Sunday, June 14, 2020

Data Model in Power Pivot for Excel or Power BI (Table Normalization & Denormalization)

Normalization & Denormalization of Table or Database in Power BI

This topic is not limited to Power BI. if you have worked on relational databases so probably you are familiar with these words. Normalization is nothing but a method or way to keep data in multiple connected tables to remove repetition and vice-versa denormalization. When all information related to a set of data is maintained in a single table then we can say it is a denormalized table See below image for better clarification.
Example of denormalize table

Now observe the second image carefully. now one table is truncated and a new table has existence in the data model. in this form category and subcategory's duplication is removed. it saves lots of memory without losing the data.


Table Normalization is the root of all data models not only for Power BI. Let's Go with me with an upcoming webinar on 14th June 2020 Sunday at 2 PM. and Learn At Home with Me


Meeting link will be sent to your registered mailing address. If you have not registered yet so CLICK HERE to Register.

Friday, June 5, 2020

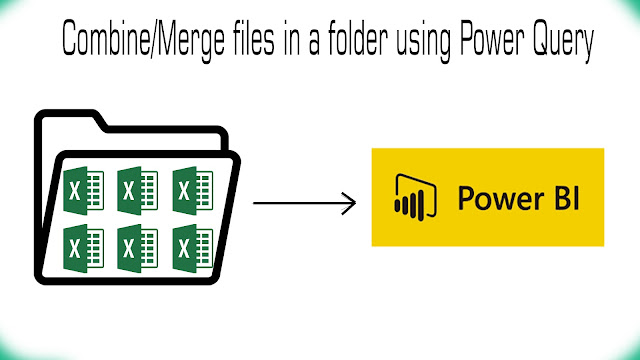
Combine Multiple Files From A Folder with Power Query Editor in Power BI or Excel

Combine/Merge files in a folder using Power Query

In this webinar, We will talk to combine options in Microsoft Power Query or M Language.
To start the process of combining various files, first, ensure that all the files you want to combine are contained in an individual file folder. and also the same type. Excel, Text/CSV, and MS Access files are supportive.

Combile or merge multiple files in a folder


Automation becomes crucial nowadays for working professionals. it is time obliged to work faster so Business can take resolutions on finger-tips. In Excel merger is a very tidy process. but don't worry with power query you can automate it.

On the Forthcoming webinar on 7 June 2020 at 2 PM, we will review this matter with details. See you there.


Meeting link will be sent to your registered mailing address. If you have not registered yet so CLICK HERE to Register.